Understand the Numbers Behind a Healthier Fishery
Fisheries mathematics transforms fish length and weight measurements into practical indicators of fish condition, population balance, and long-term pond health.
Relative Weight
Relative Weight compares a fish’s actual weight with the standard weight expected for a healthy fish of the same length.

- Uses actual fish length and weight
- Compares fish with a species standard
- Helps evaluate fish body condition
- Can be tracked by size class and time
Measuring Fishery Health With Length and Weight
Modern fisheries mathematics grew from the work of fisheries researchers Richard O. Anderson and Gary J. Wege during the 1970s. Their research established a practical method for evaluating fish condition using actual length and weight measurements.
Their original work focused on largemouth bass collected from Midwestern ponds. Researchers later applied the same principles to other gamefish and panfish species.
Today, these calculations help pond owners and fisheries professionals evaluate fish condition in ponds, lakes, rivers, streams, and other managed fisheries.
Measurements Become Management Information
A fish’s weight alone does not reveal whether it is in good condition. Its weight must be evaluated in relation to its species and length.
- Compare fish of different lengths
- Evaluate individual fish condition
- Identify struggling size classes
- Monitor changes across sampling events
- Support stocking and harvest decisions
Establishing a Healthy Weight for a Fish’s Length
Standard Weight provides a scientifically developed reference weight for a fish of a particular species and length.
What Is Standard Weight?
Standard Weight, written as Ws, estimates the weight of a fish in good condition at a particular length.
Species-specific equations are developed through regression analysis using large collections of fish length and weight data from multiple bodies of water.
- Specific to each fish species
- Based on large fisheries datasets
- Changes according to fish length
- Provides a consistent comparison standard
Standard Weight Formula
The general relationship between fish length and Standard Weight is:
Ws = aLb
In this equation:
- Ws is accepted Standard Weight of a fish of length "L"
- "L" is the fish’s total length
- "a" is the species-specific density-based coefficient
- "b" turns units of length into units of volume
- Weight = Density (a) x Volume (Lb)
Turning a Growth Curve Into a Usable Calculation
A logarithmic transformation converts the curved relationship between fish length and weight into a linear equation that can be analyzed and applied consistently.
Transforming the Equation
The general Standard Weight equation begins with:
Ws = aLb
Taking the base-10 logarithm of both sides produces:
log 10(Ws) =
log 10(a) +
b log 10(L)
This resembles the familiar linear equation y = mx + c, where the exponent b becomes the slope and log 10(a) becomes the intercept.
Henson’s Standard Weight Equation
Jeffrey Henson developed the commonly used Standard Weight equation for largemouth bass in 1991.
English Units
log 10(Ws) =
−3.587 +
3.273 log 10(L)
Use fish length in inches. Standard Weight produced in pounds.
Metric Units
log 10(Ws) =
−5.528 +
3.273 log 10(L)
Use fish length in millimeters. Standard Weight produced in grams. The intercept changes with the units, but the slope remains 3.273.
What the Numbers Revealed at Oso Lake
Length and weight records collected from Oso Lake demonstrated how Standard Weight comparisons can expose an unhealthy fish population and guide corrective management.
An 85-Acre Trophy Bass Lake
The lake had historically produced largemouth bass weighing more than 10 pounds. However, fishing records collected during 2004 suggested that the fish population had shifted toward smaller, lighter fish.
The pond owner completed 10 rod-and-reel sampling trips between April and December and recorded the length and weight of 223 largemouth bass.
- Fish length ranged from 10.25 to 16.75 inches
- Fish weight ranged from 0.5 to 3 pounds
- Only one sampled bass measured over 16 inches
- Many fish plotted below the Standard Weight curve
Too Many Predators and Too Little Forage
An electrofishing survey produced results similar to the owner’s rod-and-reel records. The fisheries biologist determined that bass density was too high while the available forage population was too low.
To restore the lake’s trophy-bass potential, the management plan included:
- Restocking threadfin shad
- Reducing largemouth bass density
- Culling bass below the target Relative Weight
- Continuing length and weight sampling
- Tracking changes across future seasons
Comparing an Actual Fish With Its Standard Weight
Relative Weight evaluates fish condition by comparing a fish’s measured weight with the Standard Weight expected for its species and length.
Calculating WR
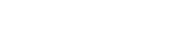
In this equation:
- WR is Relative Weight
- Wact is the fish’s measured weight
- WS is Standard Weight at the same length
A fish weighing exactly its calculated Standard Weight has a Relative Weight of 100%.
What the Relative Weight Indicates
Relative Weight provides a consistent way to compare fish condition across different lengths and sampling events.
- Below 95% may indicate poor body condition
- Approximately 95% or higher is generally considered healthy
- 100% means the fish meets Standard Weight
- Above 100% means the fish exceeds Standard Weight
Management targets can vary according to the goals of the fishery. A trophy-bass program may use a higher Relative Weight target than a general recreational pond.
Identify Which Size Classes Need Attention
A pond’s overall average can hide important differences between small, medium, and large fish. Length bins make those differences easier to identify.
PondStat groups sampled fish into defined length ranges and calculates the Average Relative Weight for the fish within each range.
This allows pond owners and fisheries professionals to determine whether a particular size class is maintaining good body condition or struggling because of competition, limited forage, or other factors.
What the Bin-Size Chart Shows
PondStat combines fish counts and Average Relative Weight to show both population distribution and fish condition.
- Each bin represents a defined fish-length range
- Bars show the number of fish sampled in each bin
- Data points show Average Relative Weight
- Error bars show variation within the sample
- Empty bins identify missing size classes
A declining Average Relative Weight as fish size increases may indicate that larger predators do not have enough appropriately sized forage.
See How Fish Condition Changes Across Months and Years
Comparing Average Relative Weight across multiple sampling dates can reveal seasonal patterns, recurring problems, and responses to pond management activities.
Patterns That One Sample Cannot Show
A single sampling event provides only a snapshot. Repeated sampling makes it possible to see whether fish condition is improving, declining, or following a recurring seasonal pattern.
- Compare individual sampling dates
- Track changes across seasons
- Identify recurring annual problems
- Measure responses to stocking and harvest
- Compare fish condition across multiple years
These trends can help identify issues such as seasonal forage losses, low dissolved oxygen, excessive predator density, or changes in feeding conditions.
Management Changes Became Visible
Average Relative Weight was calculated for each of the 10 Oso Lake sampling sessions completed between April and December 2004.
Bass condition remained below a Relative Weight of 1.00 through much of the year and did not reach or exceed that level until November.
- Early samples showed poor bass condition
- Threadfin shad were stocked twice by late September
- The forage additions supported improving fish condition
- Winter Relative Weight values increased
- Continued sampling documented the response
Standard Weight Expressions Used by PondStat
PondStat applies species-specific intercepts and slopes to calculate Standard Weight from each fish’s measured length.
| Largemouth Bass | |||||
| Smallmouth Bass | |||||
| Bluegill | |||||
| Coppernose Bluegill | |||||
| Green Sunfish | |||||
| Redear Sunfish | |||||
| Black Crappie | |||||
| White Crappie | |||||
| Channel Catfish | |||||
| Walleye | |||||
| Hybrid Striped Bass | |||||
| Rainbow Trout |
A Separate Standard Weight Expression
PondStat includes a separate expression for Coppernose Bluegill because this strain can attain unusually large sizes under favorable conditions. The specialized equation provides a more appropriate comparison than the general Bluegill expression.
Evaluate the Size Structure of Your Fish Population
Proportional Size Distribution uses species-specific length categories to show how sampled fish are distributed across important size classes.
Stock, Quality, Preferred, Memorable and Trophy
Fisheries biologists use five length thresholds to describe the size structure of a fish population. The specific lengths vary by species.
Minimum size used when evaluating the population.
A fish considered desirable to most anglers.
A larger fish preferred by many anglers.
A fish large enough to create a memorable catch.
An exceptional fish near the upper size range for its species.
| Black Crappie | |||
| Bluegill | |||
| Coppernose Bluegill | |||
| Channel Catfish | |||
| Green Sunfish | |||
| Hybrid Striped Bass | |||
| Largemouth Bass | |||
| Rainbow Trout | |||
| Redear Sunfish | |||
| Smallmouth Bass | |||
| Walleye | |||
| White Crappie |
On smaller screens, swipe horizontally to review all table columns.
Understand How Species Affect One Another
PondStat can track multiple species on the same graph, helping pond owners and fisheries professionals identify relationships within the fish community.
Compare Predator and Forage Species
Track predators such as largemouth bass alongside important forage species such as Bluegill, Green Sunfish, or Redear Sunfish.
- Compare changes in body condition
- Monitor predator demand
- Evaluate forage availability
- Identify possible population imbalances
Identify Shared Resource Pressure
Species occupying similar ecological roles may compete for the same food, habitat, or spawning resources.
- Compare similar predator species
- Track competing panfish populations
- Review changes across size classes
- Recognize emerging competition
Connect Fish Data With Pond Conditions
Fishery performance can also be compared with management activities and environmental changes recorded in PondStat.
- Forage-fish stocking
- Pond fertilization
- Aquatic vegetation
- Water-quality conditions
- Feeding and harvest records
Research Behind the PondStat Calculations
PondStat’s fisheries calculations are based on published research, species-specific Standard Weight equations, and established fisheries assessment methods.
Anderson and Wege, 1978
Gary J. Wege and Richard O. Anderson. “Relative Weight (WR): A New Index of Condition for Largemouth Bass.” New Approaches to the Management of Small Impoundments, North Central Division, American Fisheries Society Special Publication Number 5, pages 79–91, 1978.
Henson, 1991
Jeffrey C. Henson. Quantitative Description and Development of a Species-Specific Standard Growth Form for Largemouth Bass With Application to the Relative Weight Index. Thesis, Texas A&M University, 1991.
Additional Species and Assessment Research
Species-specific Standard Weight expressions and Proportional Size Distribution values presented on this page also draw from research credited to:
- Blackwell, Brown and Willis
- Murphy, Willis and Springer
- Henson
- Kolander and colleagues
- Hillman
- Bister and colleagues
- Pope and colleagues
- Neumann and Murphy
- Gabelhouse
- Simpkins and Hubert
- Dumont and Neely
- Alabama Cooperative Extension
Your pond is telling a story. Start tracking it.
Turn every catch into useful fishery information. PondStat handles the calculations and organizes the results so you can follow your pond’s progress with greater clarity and confidence.