Fisheries Mathematics – A Brief Look
Fisheries mathematics is governed by the groundbreaking work R. O. Anderson and G. J. Wege conducted back in the 1970s. This work is the cornerstone of all fisheries mathematics and is considered the method to determine the health of a fishery – be it a pond, river, stream or creek.
The work of Anderson and Wege opened up the field for development of a mathematical tool to determine the health of a fishery based on actual weight and length. Their initial study on the largemouth bass was conducted on 18 Midwestern ponds. Since then, numerous studies have been conducted for other species, all following the work of Anderson and Wege.
What follows is a very condensed description of fisheries mathematics/statistics and its application to pond management.
Standard Weight (WS)
Standard Weight (WS) is an expression (equation) that provides the average weight of fish within the 75th percentile of a specific bin size or length. These expressions are developed by regression analysis of a very large sample of data, generally taken from several bodies of water. The general equation for Standard Weight is shown in Equation 1 below and an example of a Standard Weight equation is presented in Equation 2, which is the equation developed by Henson in 1991 that built on the work of Wege and Anderson for largemouth bass.
 (1)
(1)
where “a” is the y-intercept of the line generated by the expression and “b” is the slope of that line.
Looking at Henson’s equation for WS below,
 (2)
(2)
where the y-intercept “a”  and the slope “b”
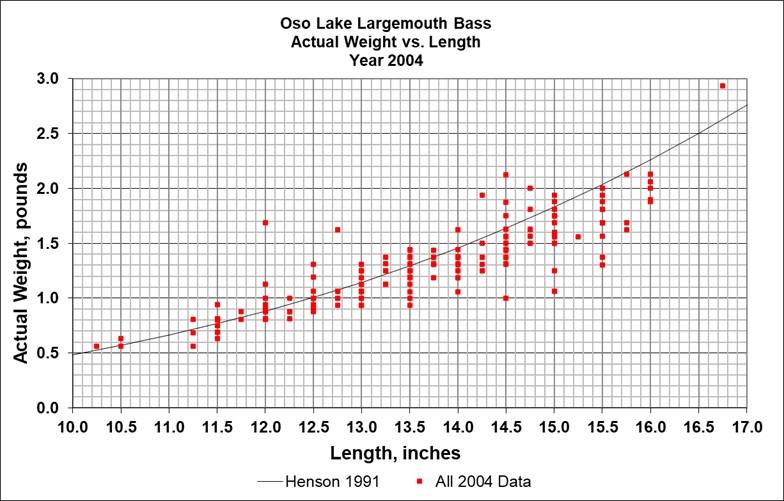
With the Standard Weight equation, the health of a fishery could be tracked by recording weight and length measurements of fish sampled and comparing those values to WS. Graph 1 provides a example of typical data plotted against the WS curve.
Graph 1, is a standard graph used by biologists to determine the health of a fishery. In this graph, largemouth bass data (red dots) from Oso Lake in southern California was plotted against the Standard Weight line (solid black curve) of Henson. Data that falls below the solid line are fish that do not meet the definition of healthy whereas data that falls on the line or above it, are fish that do meet the definition of healthy.
From this graph, it’s easy to see the fishery needs help. Unfortunately, this graph doesn’t give a reason why the fishery is struggling. Reasons could be too high of a predator population, too low a forage population, low water, or a combination of those listed. It was at this point a biologist was consulted.
Over the course of 2004, the pond owner made 10 trips to the pond between April and December and caught 223 bass by hook and line. Each bass was weighed and measured. All of the fish caught measured between 10.25 and 16.75 inches and weighed between 0.5 and 3 pounds. For an 85-acre lake, the fish population seemed scewed on the small end as only one bass was caught over 16 inches.
This lake was over 40 years old and historically had produced bass over 10 pounds. Was the sampling technique, rod and reel, not sufficient or had the predator/prey population, over the years of closure, changed that drastically.
The biologist came out and surveyed the lake by electroshocking. The data collected mirrored the data from rod and reel sampling. The biologist was able to determine the number density for bass was too high and the forage density too low. Because this was going to become a trophy bass lake, recommendations were made to restock threadfin shad into the lake and cull any bass with a Relative Weight (WR) less than 1.0. But what is Relative Weight?
Relative Weight (WR)
Relative Weight (WR) is the metric in which a fish is judged to be healthy or not. Mathematically speaking, it is,
 (3)
(3)
where Wact is the actual weight of a fish of a certain length.
Because Henson’s equation uses the average from the 75th percentile of data, the equation is automatically scewed heavy. In general, biologists say that any fish with a WR ≥ 0.95, is deamed healthy. Because this fishery was going to be operated as a trophy bass fishery, the biologist suggested all bass below WR = 1.0 be removed from the lake. As it would turn out, in subsequent years this value would be increased incrementally from 1.0 to 1.2 and eventually to 1.25.
Knowing Relative Weight (WR) still doesn’t provide all the answers, though. By tracking length and weight data for an extended amount of time, it’s possible to determine if year-class fish, or fish within a certain length bracket, are healthy or not. This is where PondStat allows the pond owner or biologist to do a simple deep dive into the data and see more clearly which year-class fish are doing good and which ones need to be culled.
Number of Fish and Average Relative Weight vs. Bin Size
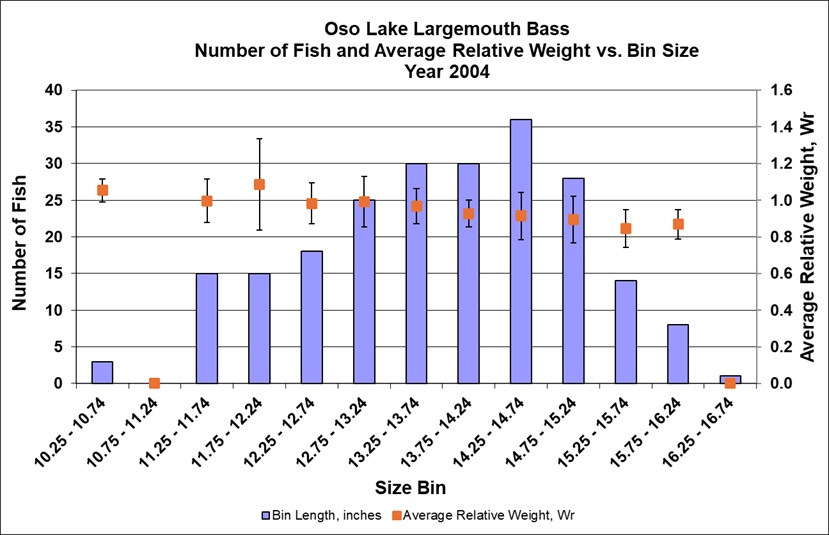
As mentioned above, tracking data for an extedned period of time provides a larger picture of what is actually going on in your pond. One of these techniques is to break the data down into length bins and compare the Average Relative Weight ( ) within the bin sizes. This reveals the health of certain length or year-class fish with other year-class fish.
Graph 2 presents this exact set of data. The bars represent the number of fish caught in that length slot while the orange points are the Average Reative Weight for the fish caught in that length slot. The error bars are the standard deviation of the range for data. Average Relative Weight data points located at 10.75 – 11.24 and 16.25 – 16.74 are zero because the number of fish caught in those bins was zero and 1 respectively. Still, the graph provides some interesting data regarding  versus the size of the fish, with
  decreasing as the size of the fish increases.
The cause of this, as noted above, was too high of a predator density and too low of a forage base.
This is the type of analysis that really tells the story about the health of a fishery but has never been available to the pond owner without a lot of work. It is also the exact type of data a fisheries biologist needs over a long period of time in order to fully understand the dynamics of a fishery.
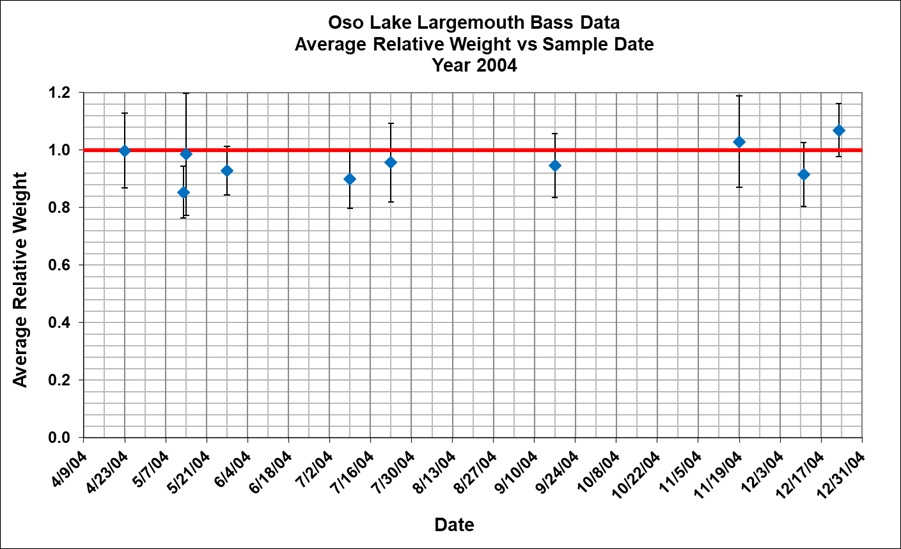
Another type of graph helpful in pond management is  versus Sample Date. Data presented in this manner allows for the tracking of
  over months, seasons, or even years. Data accumulated over this amount of time can allow a pond owner to see cyclic problems before they occur, like a late summer forage dieoff that always happens, or maybe wintertime fishkill due to a decrease in dissolved oxygen.
This takes us back to the Oso Lake data where the  has been plotted for all 10 sampling sessions. The spawn on this lake had been over in early March and one would expect the
  to be low maybe through April. But a look at Graph 3 reveals it never got to 1.0 or above until November.
By late September 2004 the lake had been stocked twice with threadfin shad to boost the forage population, which raised the  in the winter months.
Fish Species Available in PONDSTAT
The number of species available to track in PondStat is currently set at nine. We have placed the most popular private pond gamefish and panfish into the software, but this does not mean we are limited to these nine. If there becomes a need to add more, we can do that in the future. Table 1 below lists the species currently in the database as well as the biologists who developed the Standard Weight expressions, the minimum length they are accurate to, along with the slope and intercept for each equation.
| Largemouth Bass (1) | |||||
| Smallmouth Bass (1) | |||||
| Bluegill (1) | |||||
| Bluegill (2) | |||||
| Green Sunfish (1) | |||||
| Redear Sunfish (1) | |||||
| Black Crappie (1) | |||||
| White Crappie (1) | |||||
| Channel Catfish (1) | |||||
| Walleye (1) | |||||
| (1) Taken from Blackwell, Brown, and Willis. Relative Weight (Wr) Status and Current Use in Fisheries Assessment and Management, Reviews in Fisheries Science, January 2000. (2) Taken from aces.edu Alabama A&M and Auburn Universities. |
|||||
PondStat offers multiple species analysis, therefore, multiple species can be tracked on the same graph. This aids in the determination of correlations between species, whether it be predator/prey relationships or two species competing in the same environment. As an example, panfish are considered prey for black bass, therefore it becomes advantageous to track bluegill, green sunfish, or redear with bass to see if there are any correlations between the species. You can also track pond health by tracking forage fish stocking, pond fertilization, and weed growth. PondStat has inputs for nearly all variables that affect the wellbeing of a pond or small lake.


